 English
 Chinese
 Korean
 Hebrew
 Russian
Real Estate in Englewood Cliffs, Bergen County, NJ
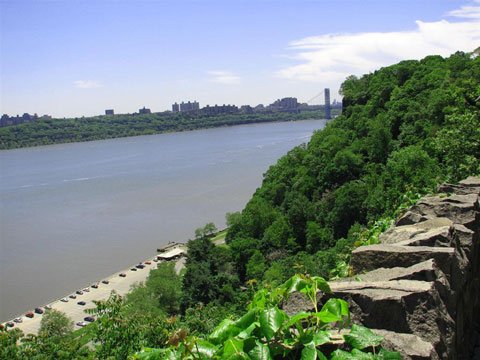
Situated atop the Palisades north of Fort Lee and only 5 minutes from the George Washington Bridge. Englewood Cliffs is mostly a higher end residential neighborhood with large properties and few community services. It is one of Bergen County’s wealthier bedroom communities.
Englewood Cliffs are also home to many large companies corporate headquarters such as CNBC & Unilever which keeps the property taxes low.
Children to go to schools in the neighboring towns or sent to private schools.
Zip code: 07632
Median Family income: $213,261
Average Property Tax: $10,414(2012)

Real Estate in Englewood Cliffs
Why buy Real Estate in Englewood Cliffs?
- Englewood Cliffs are the nearest Bergen County small town to Manhattan only 3.5 miles from George Washington Bridge.
- Englewood Cliffs have low real estate taxes, and mostly large properties and homes
- Englewood Cliffs residents enjoy beautiful large homes, closeness to Manhattan and many send their children to private education. Read more about Englewood Cliffs’ schools
- Englewood Cliffs – borders Englewood and its residents enjoy the gorgeous Englewood rich downtown
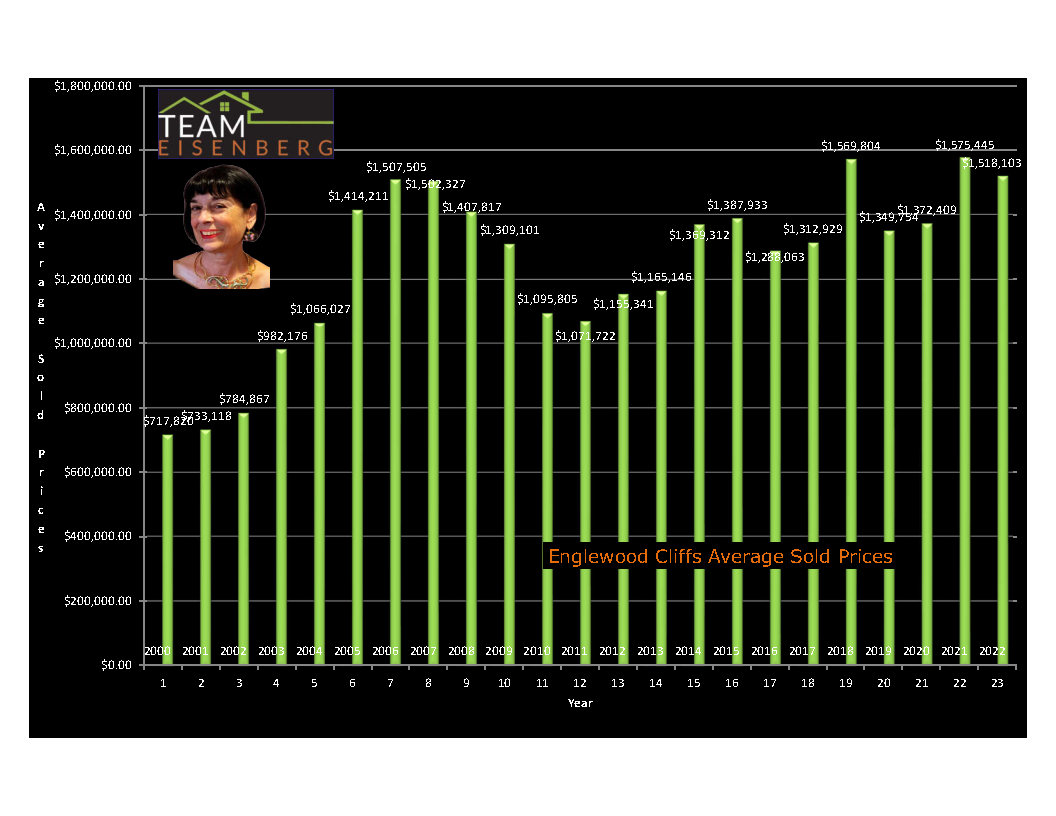
The average price of homes sold in Englewood Cliffs between January 2005 and December of 2012 was $1,325,746 and the median price was $1,100,000. Englewood Cliffs have seen h3 growth in sales in recent years with average prices in 2012 nearing those of 2005. Most homes that sold for over $1,000,000 were of a Colonial style, while those that sold for less than one Million were of mixed styles such as Split Level, Bi-Level and Ranches.
Englewood Cliffs Real Estate Statistics
| Year | 2000 | 2001 | 2002 | 2003 | 2004 | 2005 | 2006 | 2007 | 2008 |
|---|---|---|---|---|---|---|---|---|---|
| Avg. $sold price | 717,820 | 733,118 | 784,867 | 982,176 | 1,066,027 | 1,414,211 | 1,507,505 | 1,502,327 | 1,407,817 |
| % Change | na | +2% | +7% | +25% | +8.5% | +32% | +6.5% | 0% | -6% |
| Year | 2009 | 2010 | 2011 | 2012 | 2013 | 2014 | 2015 | 2016 | 2017 |
|---|---|---|---|---|---|---|---|---|---|
| Avg. sold price | 1,309,101 | 1,095,805 | 1,071,722 | 1,155,341 | 1,165,146 | 1,369,312 | 1,387,933 | 1,288,063 | 1,312,929 |
| % Change | -7% | -16% | -2.2% | +7.8% | +1% | +17.5% | +1.3% | -7% | +1.9% |
| Year | 2018 | 2019 | 2020 | 2021 | 2022 | 2023 | 2024 | 2025 | 2026 |
|---|---|---|---|---|---|---|---|---|---|
| Avg. $sold price | 1,563,951 | 1,349,754 | 1,372,409 | 1,575,445 | 1,518,103 | 1,756,315 | 1,962,229 | ||
| % Change | +19% | -14% | +1.6% | +15% | -4% | +16% | +12% |
Click here for the Englewood Cliffs SoldReports
Englewood Cliffs Average Sold Prices
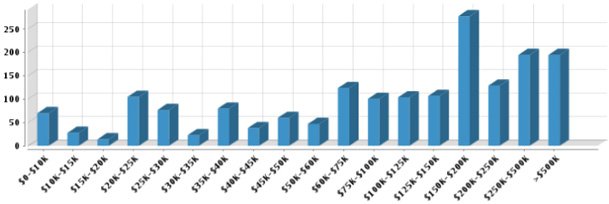
Household Income
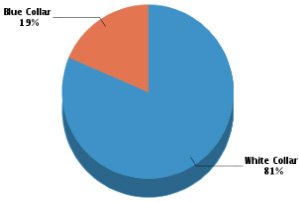
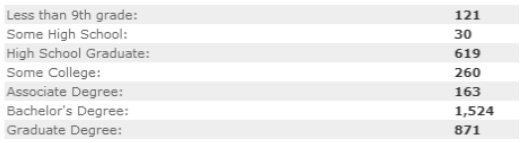
Occupation & Education:
The occupation makes up of the Englewood Cliffs population is 81% “White Collar” and 19% “Blue Collar”. Over 3500 residents hold graduate or higher academic degrees and approximately 3200 hold academic bachelor degrees.
Want to read more about Englewood Cliffs? Read our Englewood Cliffs community information page.