 English
 Chinese
 Korean
 Hebrew
 Russian
Real Estate in Englewood, Bergen County, NJ
Englewood’s population is far more diverse than that of most suburbs including many of its Bergen County neighbors. Occupations range from highly paid professions to unskilled trades. At present Englewood is a sophisticated city which combines most of its historic grace & charm with an exciting cosmopolitan atmosphere. It has many contrasts: elaborate Victorian Mansions and modern low-rise condos; quiet tree-lined residential neighborhoods & the bustling central business district; large estates & affordable apartments.
Zip code: 07631
Median Family income: $93,134
Average Property Tax: $10,838.89(2012)

Real Estate in Englewood
Why buy Real Estate in Englewood?
- Englewood is the nearest Bergen County médium sized town to Manhattan only 3.5 miles from George Washington Bridge.
- Englewood offers a wide variety of real estate solutions from multi-million dollar homes to more affordable ones.
- Englewood residents enjoy a vibrant downtown and in addition to a public school system, some superb private schools. Read more about Englewood Schools
The average price of homes sold in Englewood between January 2005 and December 2012 was $644,908 and the median price was $415,000. Englewood is home to ‘Gloria Crest Estate’, former home to screen legend Gloria Swanson. Offered for sale for $39,000,000 Englewood is also home to less expensive homes with only 10 properties that sold for over one million in 2012 out of 102.
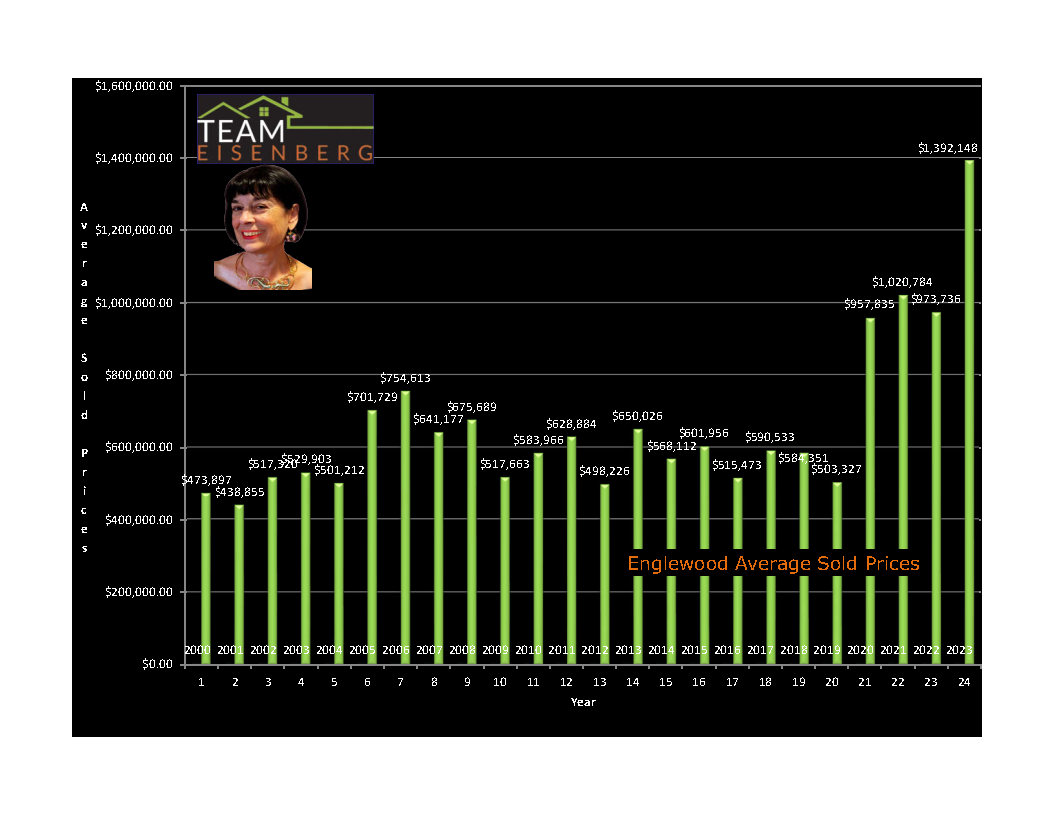
Englewood Real Estate Statistics
| Year | 2000 | 2001 | 2002 | 2003 | 2004 | 2005 | 2006 | 2007 | 2008 |
|---|---|---|---|---|---|---|---|---|---|
| Avg. $sold price | 473,897 | 438,855 | 517,320 | 529,903 | 501,212 | 701,729 | 754,613 | 641,177 | 675,689 |
| % Change | na | -7% | +17% | -2.5% | -5% | +40% | +7.5% | -15% | +5% |
| Year | 2009 | 2010 | 2011 | 2012 | 2013 | 2014 | 2015 | 2016 | 2017 |
|---|---|---|---|---|---|---|---|---|---|
| Avg. sold price | 517,663 | 583,966 | 628,884 | 498,226 | 650,026 | 568,112 | 601,956 | 515,473 | 590,533 |
| % Change | -23% | +13% | +7.7% | -20% | +30% | -13% | +6% | -14% | +14.5% |
| Year | 2018 | 2019 | 2020 | 2021 | 2022 | 2023 | 2024 | 2025 | 2026 |
|---|---|---|---|---|---|---|---|---|---|
| Avg. $sold price | 592,103 | 503,327 | 957,835 | 1,020,784 | 973,736 | 1,392,148 | 1,112,404 | ||
| % Change | na | -15% | +90% | +7% | -4% | +43% | -20% |
Click here for the Englewood SoldReports
For Sale – 264 Morrow Road Englewood
Englewood Average Sold Prices
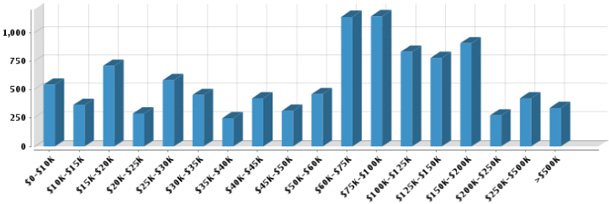
Household Income
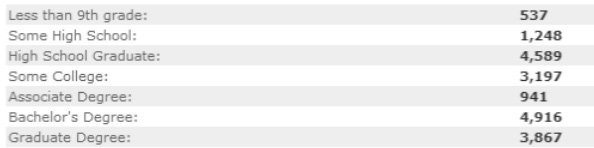
Occupation & Education:
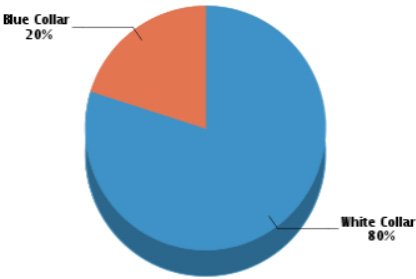
The occupation make-up of the Englewood population is 81% “White Collar” and 19% “Blue Collar”. Over 3500 residents hold graduate or higher academic degrees and approximately 3200 hold academic bachelor degrees.
Want to read more about Englewood? Read our Englewood community information page.